WHAT ARE MULTIPLE TIME FRAMES?
MULTIPLE TIME FRAME STRUCTURE
Noted author and technical analysis expert Perry Kaufman, in his book Trading Systems and Methods -Third Edition published by John Wiley & Sons, discusses multiple time frame analysis. Here, used with Mr. Kaufman's permission, are his thoughts.
Robert Krausz's Multiple Time Frames
"Although multiple time frame techniques have become more visible, the most robust approach has been taken by Robert Krausz. To understand the importance of first arriving at a sound theory before implementing and testing a trading program, we need to briefly review the characteristics of performance that indicate a robust method.
When testing a trend-following system, we should expect that a trend of 100 days, compared with a trend of 50 days, will produce greater consistency, greater reliability, and proportionally fewer trades. As you increase the calculation period, this pattern continues; when you reduce the calculation period this pattern reverses. You are prevented from using very short calculation intervals because slippage and commissions become too large; the longest periods are undesirable because of large equity swings. There must be a clear, profitable pattern when plotting returns per trade versus the average holding period.
The sophistication in Krausz's work lies in his understanding of this pattern, and its incorporation into the structure of his program, The Fibonacci Trader. Krausz works in three time frames rather than two. Each time frame has a logical purpose and is said to be modeled after Gann's concept that the markets are essentially geometric. The shortest time frame is the one in which you will trade, in addition, there are two longer time frames to put each one into proper perspective.
The patterns common to time frames are easily compared with fractals; within each time frame is another time frame with very similar patterns, reacting in much the same way. You cannot have an hourly chart without a 15-minute chart, because the longer time period is composed of shorter periods; and, if the geometry holds, then characteristics that work in one time frame, such as support and resistance, should work in shorter and longer time frames. Within each time frame there are unique levels of support and resistance; when they converge, increasing stability. In Krausz's work, the relationships between price levels and profit targets are woven with Fibonacci ratios and the principles of Gann.
One primary advantage of using multiple time frames is that you can see a pattern develop sooner. A trend that appears on a weekly chart could have been seen first on the daily chart. The same logic follows for other chart formations. Similarly, the application of patterns, such as support and resistance, is the same within each time frame. When a support line appears at about the same level in hourly, daily, and weekly charts, it gains importance.
As a well know trader, Krausz brings more than just three time frames and some unique strategies to the display screen. He endows the program with six rules:
LAWS OF MULTIPLE TIME FRAMES
1. Every time frame has its own structure.
2. The higher time frames overrule the lower time frames.
3. Prices in the lower time frame structure tend to respect the energy points of the higher time frame structure.
4. The energy points of support/resistance created by the higher time frame's vibration (prices) can be validated by the action of lower time periods.
5. The trend created by the next time period enables us to define the tradable trend.
6. What appears to be chaos in one time period can be order in another time period.
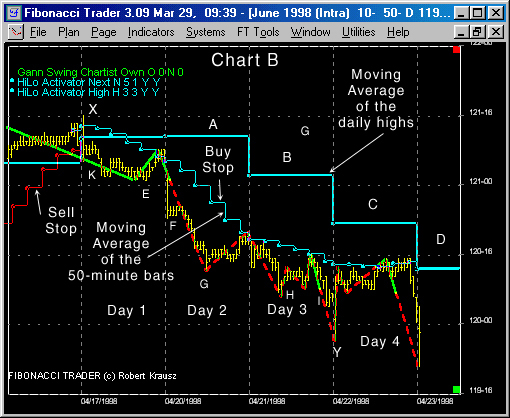
Using three time frames of about the same ratio to one another (10-minute, 50-minute, and daily), with daily being the longest, Charts A and B shows the June 98 contract of U. S. bonds with a number of techniques applied over multiple time frames. Chart A uses only daily bars, while Chart B has 10-minute bars, both charts are drawn on the same price scale to facilitate comparison.
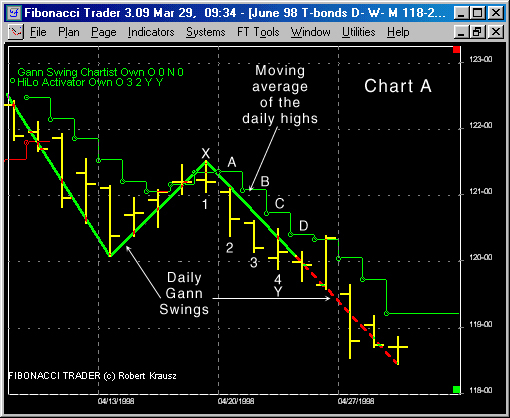
To understand the application of these techniques, it is necessary to identify the following features:
1. The Daily HiLo Activator (in this case, it is the moving average of the daily highs) is presented as a stepped line. The four days of interest are marked by the letters A, B, C, and D and appear on both Charts A and B.
2. The 50-minute HiLo Activator (seen in Chart B) is the moving average of the 50-minute highs, used as a Buy Stop, or the moving average of the 50-minute lows, used as a sell stop.
3. The 10-minute Gann swings, based on the 10-minute bars (seen in Chart B). The solid line Gann swing represents an upward trend, and the broken line when it shows a downtrend.
The interpretation of these techniques relies on the faster response by the 10-minute bars, combined with the direction given by the longer time frames.
1. Based on the 10-minute Gann swings, the trend turned from up to down at about 121-00, while the daily Gann swings place the trend change much later, near 120-00.
2. The slope of the daily Gann Swing, measured from point X to point Y on both charts, was down, defining the dominant trend. Short trades can be entered using the downtrend of the 10-minute time frame. The process of coordinating the trend of the higher time period with that of the lower time period, and acting in only that direction, seems to be the most advantageous approach. The low of each 10-minute swing, marked E, F, G, H, and I on the 10-minute bar chart, provides opportunities to add to the original position.
3. At the top left of the 10-minute chart, the 10-minute close falls below the Sell Stop of the 50-minute HiLo Activator at point K (about 120-06). The Buy Stop then applies and follows declining prices for 3 days. These changes occur in the same area where the Gann swing indicates a trend change from up to down.
4. The 50-minute moving average of the highs, shown in step formation on the 10-minute chart, tracks the highs of the market rallies on days 1, 3 and 4. The daily moving average of the highs (the daily HiLo Activator) remained level on day 2 and turned down on day 3. The trend can only change to up when the Daily HiLo Activator turns up again.
A Comment On Multiple Time Frames
In thinking out time frames it is necessary to understand that you cannot substitute a 10-period moving average of 1-hour bars with a 40-period moving average of 15-minute bars. Similarly, you cannot substitute a 10-week average with a 50-day average.
It seems natural to think that any two trends covering the same time span will give the result, but that is not the case. Although, we can average many data points, we cannot get rid of all the noise; fewer data points over the same time span will always yield a smoother result. Therefore, the use of hourly, daily, and weekly time periods multiple time frames gives a much different picture of the market than simply using three different moving averages based on the same data.
It is much easier to see the major trend using weekly data, find the short term direction based on daily data, and time short entry using hourly bars."
In the Fibonacci Trader all charts are set up in three time frames from the moment you define a chart. If you are trading the Daily TBonds for example, you can pick Daily/Weekly/Monthly time periods. This way you can see in the same chart any indicator for any of these time periods at the same time.
The next picture shows S&P Mini chart. The chart parameters are: intraday, 81 minutes bars with the next time period as Daily and highest time period as Weekly. You can see the 81 minute bars with a 4 days moving average, a 3 weeks moving average, a daily stochastics and a 5 periods 81 minute HiLo activator (exclusive on the Fibonacci Trader).
Since 1992