Heikin-Ashi Indicator
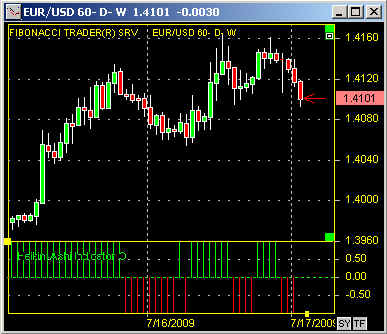
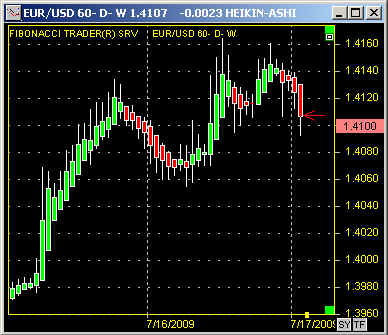
 Above regular candlestick bars and the heikin-ashi indicator.
|
The indicator will give a vertical up line when the
heikin-ashi bars are green and vertical down when the heikin-ashi
bars are red.
This is useful when you have a regular chart and wants to know how the heikin-ashi formation is like. |
* Trading any market carries a high level of risk, and may not be suitable for all investors. The high degree of leverage can work against you as well as for you. Before deciding to invest you should carefully consider your investment objectives, level of experience, and risk appetite.
* The possibility exists that you could sustain a loss of some or all of your initial investment and therefore you should not invest money that you cannot afford to lose. You should be aware of all the risks associated with trading, and seek advice from an independent financial advisor if you have any doubts.
* The Views and opinions represented in the provided website links and resources are not controlled by the Referring Broker or the FCM. Further, the Referring Broker and the FCM are not responsible for their availability, content, or delivery of services.
* You should be aware of all the risks associated with foreign exchange, futures, stocks, options, Cryptocurrencies trading, and seek advice from an independent financial advisor if you have any doubts. We do not offer any advise and trade using our software is at your own risk.
Home | Privacy Policy | Contact Information
Copyright © 1996-2020 PAS Inc.
All names mentioned in this
document are trademarks or registered trademarks of their respective
owners.
