Use the indicator window to add indicators to your charts. The top window pane lists the indicators that will be applied to your chart. The bottom window pane contains a list of all available indicators. Simply scroll to the indicator(s) of you choice, highlight and click add. You can also add an indicator to the list by double clicking it.
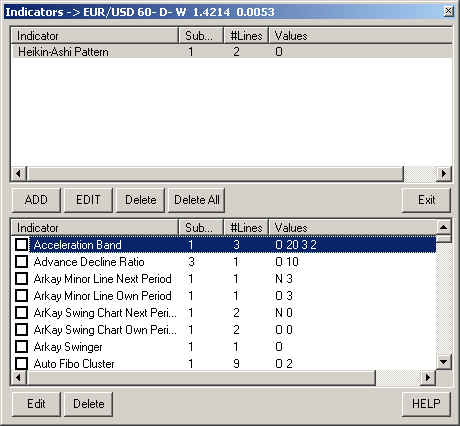
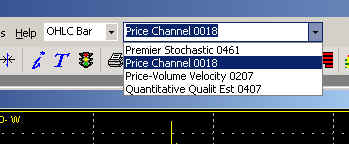
On the bottom list each indicator has a checkbox, indicators that have the checkbox checked will appear on the Favorites indicators list at the top of the program, to use that indicator on the chart just open the list and click the indicator name.
You may want to change the parameters of an indicator before applying it to a chart. To do so, highlight the indicator and click edit. Double clicking on an indicator in the top window pane will also open the edit indicator window. The 1st parameter is 'period'. 'O' stands for 'own' time period. 'N' = 'next' and 'H' = 'highest'. Use these settings to tell the program what chart time frame to use for calculating the indicator. For example, if period = 'O' then the indicator will be calculated using the chart's own time period.
The next setting allows you to select what type of price you want the indicator to use for its calculation. The available options are shown in the window below. Note that you can also tell the indicator to use another indicator as its calculation.
You can also edit the values that the indicator uses as well as offset the indicator. For offset, use only positive numbers. Use the tabs on the right side of the menu to change how the indicator looks and where it will be drawn on the chart. The style tab allows you to select the thickness and spacing of the indicator line.
Use the sub chart tab to tell the program where it should place the indicator in your chart. Chart 1 will place the indicator in the same window as the price bars. Charts 2-6 will place the indicator below the price bars.
Use the symbol tab to select what kind of symbol to use to denote the indicator value.
Use the draw type tab to change how the indicator will be drawn on the chart.
X position is used to offset the indicator in front or behind the price bars.
Use the alarm/results tab to set alarms. If you want an audible alarm to sound and an alarm window to pop up on the screen then place a check mark in the 'alarm on condition' box. Select the trade type and where the trade is to occur. Placing a check mark in the 'show trades on chart' box will place buy and sell arrows on the chart when a trade occurs.
Placing a check mark in the 'show values' box will display the actual indicator values on the chart. See the chart below.
This chart shows the MACD Histogram in a sub chart. It is using the other indicator (moving average) in the indicator list (top window pane of the indicator window) as its calculation. The type of indicator and its parameters will be shown in the top left of the same sub chart as the indicator is drawn. Clicking on the indicator name will take you to the edit window for that indicator. Right clicking on the indicator name will bring up a menu allowing you to edit, show or do not show, delete, or display the results of that indicator.
Crossing Zero Line : when an oscillator crosses its zero line from below it to above it and vice versa.
Change of Slope: when an indicator turns up or down for the 1st time.
Change of Step Direction : when using steps and you are short the program will consider a change to long when 2 steps turn up or today's step goes higher the yesterday's step. When using steps and you are long the program will consider a change to short when 2 steps turn down or today's step goes lower the yesterday's step.
* Trading any market carries a high level of risk, and may not be suitable for all investors. The high degree of leverage can work against you as well as for you. Before deciding to invest you should carefully consider your investment objectives, level of experience, and risk appetite.
* The possibility exists that you could sustain a loss of some or all of your initial investment and therefore you should not invest money that you cannot afford to lose. You should be aware of all the risks associated with trading, and seek advice from an independent financial advisor if you have any doubts.
* The Views and opinions represented in the provided website links and resources are not controlled by the Referring Broker or the FCM. Further, the Referring Broker and the FCM are not responsible for their availability, content, or delivery of services.
* You should be aware of all the risks associated with foreign exchange, futures, stocks, options, Cryptocurrencies trading, and seek advice from an independent financial advisor if you have any doubts. We do not offer any advise and trade using our software is at your own risk.
Home | Privacy Policy | Contact Information
Copyright © 1996-2020 PAS Inc.
All names mentioned in this
document are trademarks or registered trademarks of their respective
owners.