Range Bar Chart
Fibonacci Trader and Fibonacci/Galactic Trader Real Time Versions Only
The example stated are for illustrative purpose only, and should not be viewed as advice or guarantee of performance
Nicolellis Range Bars were conceived in 1995 by a Brazilian broker and trader - Vicente M. Nicolellis Jr.
During 13 years running a trading desk in Sao Paulo, where local markets tend to be volatile, he wrestled with the problem of how to handle this volatility and its variability.
Finally he concluded that the most promising approach would be to eliminate time from the equation, and just concentrate on price.
After all it is price that you trade (rather than time, unless it is an options market).
Essentially this reverts to the early days of Technical Analysis, and the use of Point an Figure Charts which just record price changes.
By using a constant range, ex. 10, and opening a new bar once that range is covered, one can also apply modern concepts of indicators, which are bar based.
In 1996 the concept was computerized, which meant that many more markets could be studied.
Experience in more than 20 years has shown that Nicolellis Range Bars are particularly good at focusing on and clarifying movement.
The way in which a long meandering, horizontal "congestion" is condensed into a bar or two, concentrates attention on the essential underlying price movement while eliminating unnecessary "clutter" and "noise".
This also makes the use of Trendlines easier.
The range bars just look price, the bar does not close at a specific time but closes when a range is complete, then a new bar opens.
If you have a market that moves from 1 to 9, then 9 to 1, then 1 to 9 during 2 days, if you create a range bar chart of $10 you will only have a bar that goes from 1 to 9 during these 2 days and this bars is not closed. If the market moves to 10 then the bar closes and a new bar opens with open price at 10. This new bar now must have $10 range to close. Let’s say the market goes back to 6 and then up to 17, the last range bar closes at 16 (making a range bar from 6 to 16) a new bar opens with open price at 16 and this bars price is now 17. This new bar has now a range of $1 (16 to 17) and will wait until a complete $10 range to close.
This is interesting in a market in congestion; you can have days with no new bar opening, the next picture shows IBM in a 78 minute chart and in a $2.50 range bar chart.
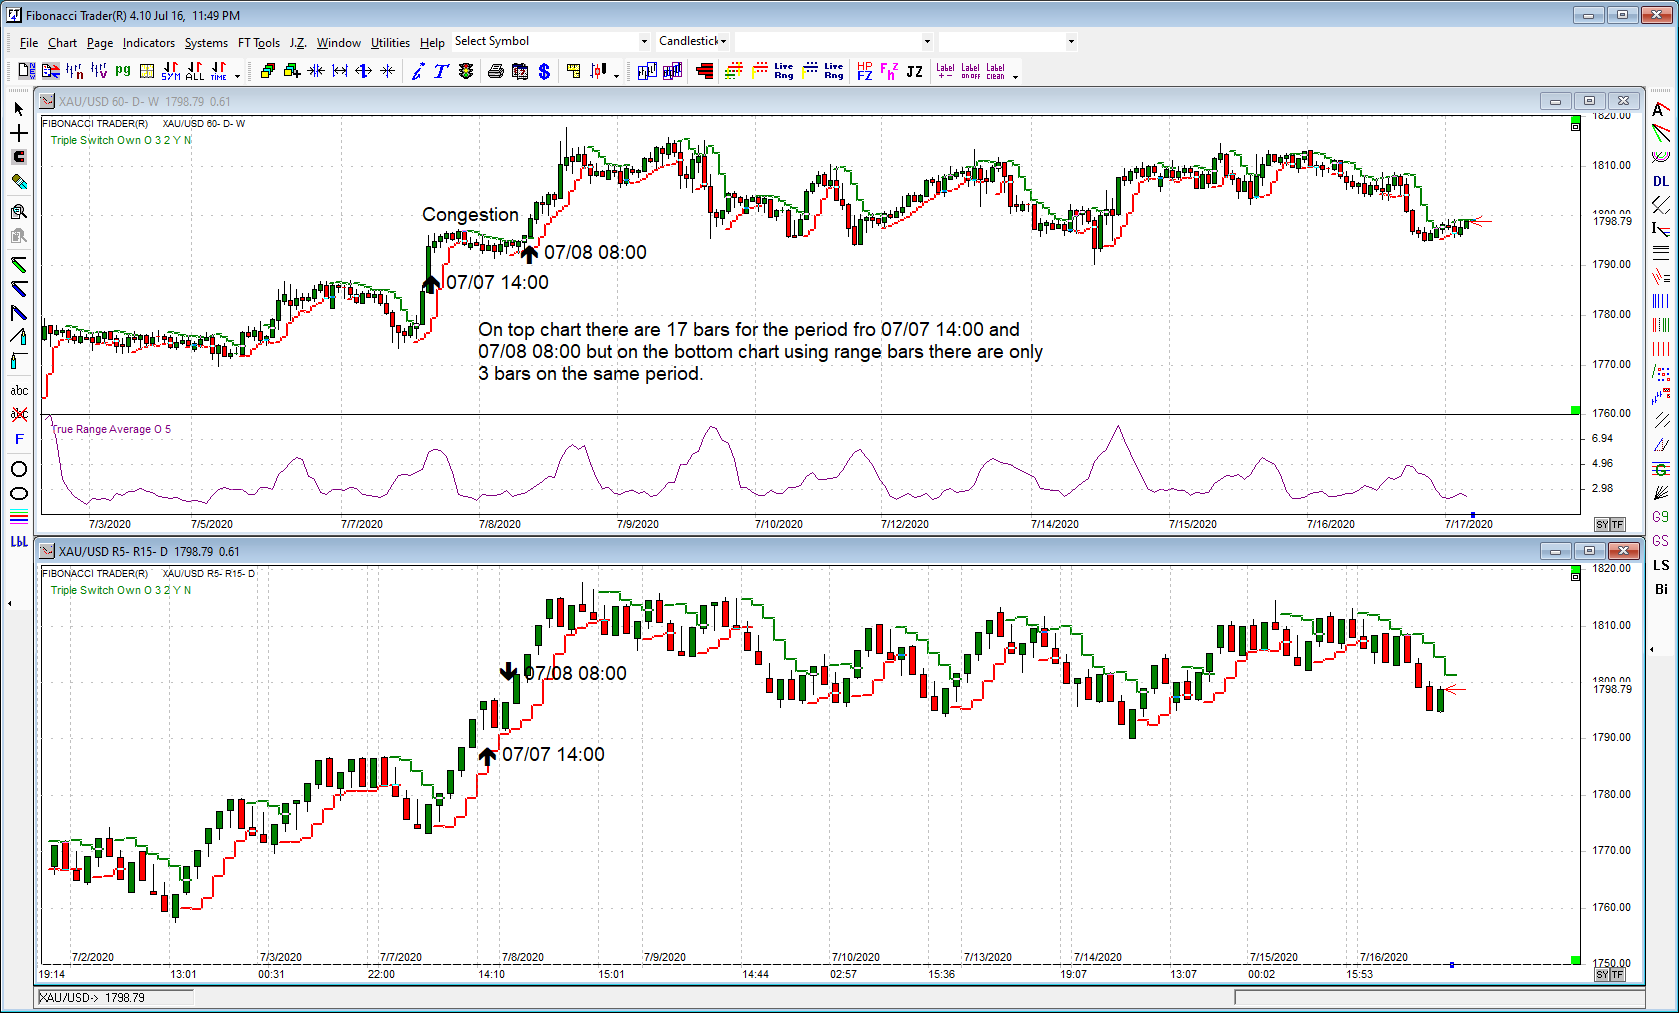
Note that from 07/07 14:00 to 07/08 08:00 the regular 60 minute chart has 17 bars while the $5 range bar has just 3.
We used the True Rnage Average on the 60 minutes bar chart to find a proper range for that time, we choose $5.
Note how a stop and reverse indicator like the Triple Switch generates much less false signals.
The program has 2 ways to create Range Bars charts.
The first way uses the 1 minute bar data to create the range bar, then these range bars have some limitations.
A very small range, that is smaller than a normal range of a 1 minute bar will create problems. In real time the program will create more than 1 range bar on the same minute, but when recreating the bars this information does not exist.
Lets say the market moves in 1 minute from 1 to 3, then 3 to 1, then 1 to 3, if you create a range bar of $1.00 in real time as the market moves you will see, 2 bars for the first move from 1 to 3, then 2 bars more for the move from 3 to 1 and then 2 bars more for the move from 1 to 3, total of 6 range bars in 1 minute.
As you close the chart and reopen it, or as the chart is rebuilt, the information from the same 1 minute bar is only a market that had a low of 1 and a high of 3, with close at 3. The program will look to this 1 minute bar and will recreate just 2 bars, one bar from 1 to 2 and one bar from 2 to 3. This chart will then be different of what actually happen in real time.
Then we recommend that you have the ranges values bigger than the oscillation of the 1 minute bars.
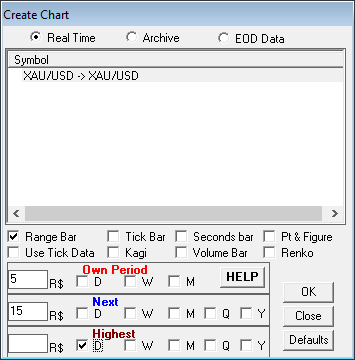
To create a range bar check the box Range Bar, type the range you want on the R$ box. Next and highest period are fixed on daily and weekly.
The second way uses tick data to create the bars (version R46 or later).
Small ranges will be OK as the chart will use tick information
To create a Range Bar chart using tick data check the Range Bar checkbox and the Use Tick Data checkbox.
We used the True Rnage Average on the 60 minutes bar chart to find a proper range for that time, we choose $5.
Note how a stop and reverse indicator like the Triple Switch generates much less false signals.
Since 1992