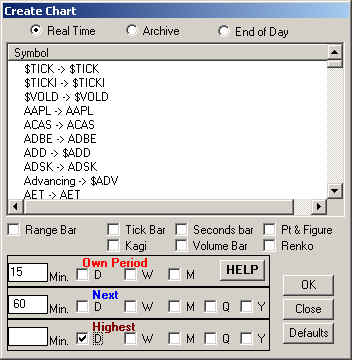
Create New Chart

Note multiple time frames are available on the Fibonacci and the Fibonacci/Galactic Trader, the Galactic Trader process to create a chart is the same but you just have 1 time frame to work with.
To create a new chart click on the symbol you want.
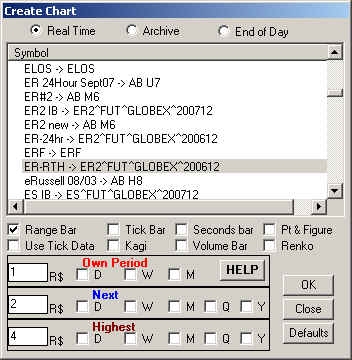
Note that now the boxes are labeled R$ not Min., you will type in there the value of the range you want for the own, next and high periods. In this example we are creating a range bar of 1 point, 2 points and 3 points for the ER2 December 2007.
The default is that the bars are created based on 1 minute data, checking the checkbox 'Use Tick Data' will make the program use tick data to create this chart, that is highly recommended for small ranges.
For more details on range bars click here.
Checking the Tick Bar checkbox you will be able to create a tick bar chart.
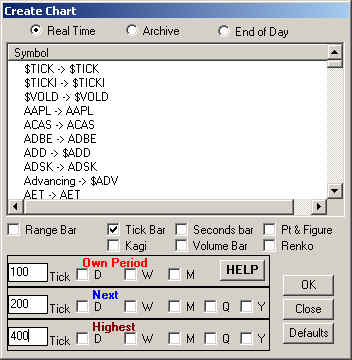
Note that now the boxes are labeled Tick not Min., you will type in there the number of ticks per bar you want for the own, next and high periods. In this example we are creating a tick bar of 100 ticks, 200 and 300.
Checking the Kagi Bar checkbox you will be able to create a kagi bar chart.
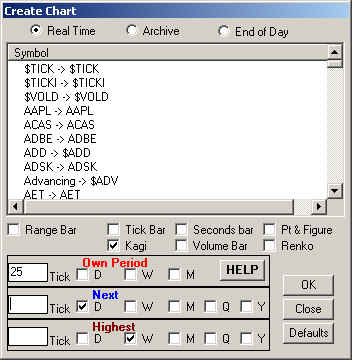
Note that now the boxes are labeled Tick not Min., you will type in there the number of ticks per bar you want for the own period, the next and highest period are set to daily and weekly automatically.
Checking the Seconds Bar checkbox you will be able to create a seconds bar chart.
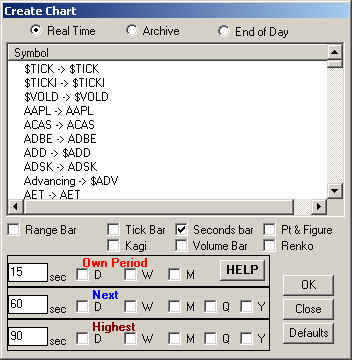
Note that now the boxes are labeled sec not Min., you will type in there the number of seconds per bar you want for the own, next and high periods. In this example we are creating a seconds bar of 15 seconds, 60 seconds and 90 seconds.
Checking the Volume Bar checkbox you will be able to create a volume bar chart.
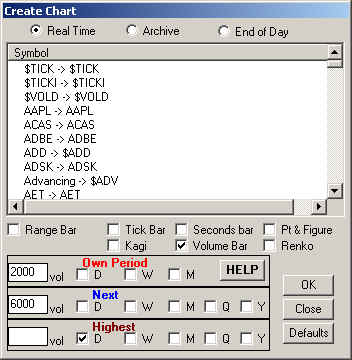
Note that now the boxes are labeled Vol not Min., you will type in there the volume per bar you want for the own, next and high periods. In this example we are creating a volume bar for a volume of 2000, 6000 and daily.
Checking the Pt & Figure checkbox you will be able to create a point and figure chart.
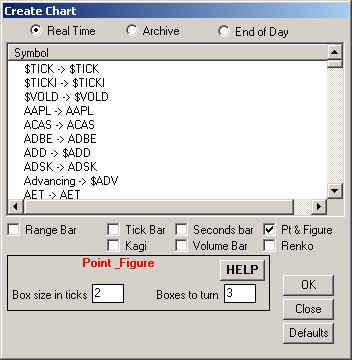
Note that now the screens change and you now need to input the size of the point and figure box in ticks and the number of boxes for a turn to happen, in this example we are creating a point and figure chart with box size of 2 ticks with a turn of 3 boxes.
Checking the Renko checkbox you will be able to create a renko chart.
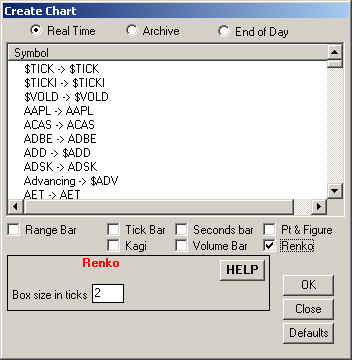
Note that now the screens change and you now need to input the size of the renko in ticks, in this example we are creating a renko chart of 2 ticks size.
For more information on Multiple Time Frames click here.
Since 1992