Divergences
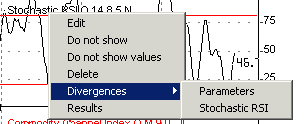
To show the divergences right click on the indicator you want, click Divergences then on the line name to show divergences, on the picture bellow if you click on Stochastic RSI this indicator line will have the divergences shown

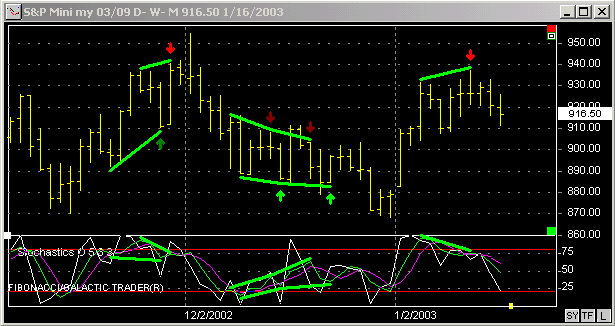
The next picture shows arrows in light red for regular divergence with trend reversal from up to down, light green for regular divergence with trend reversal from down to up, dark red for hidden divergence with trend reversal from up to down and dark green for a hidden divergence with trend reversal from down to up. This colors and lines can be changed on the divergences parameters window.

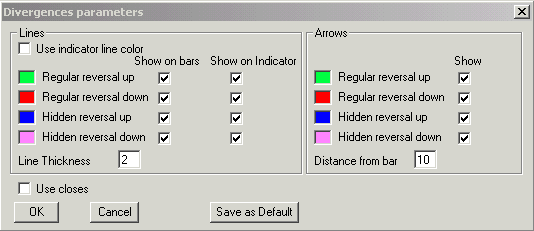
To change the parameters of the divergences click on the option Parameters.

On the lines section you will set the parameters for the divergence lines, if you have the option 'Use indicator line color' checked the divergences lines will show on the same color as the indicator line.
Divergences normally are calculated using the highs and lows of bars, the option Use close will make the divergence be calculated using just the bar's close.
Since 1992