PRODUCT REVIEW
Robert Krausz's
Fibonacci Trader
32-Bit, Version 3.01
by Stuart Evens
FIBONACCI TRADER CORPORATION
1835 US 1 South 119, Suite 352
St. Augustine, FL 32086
To order: 904 723 3650
Fax: 904 726 9511
Internet: http://www.fibonaccitrader.com
E-mail: fibbo@FibonacciTrader.com
Product: Market timing analysis utilizing multiple time frame techniques
Equipment required: Pentium 166 Mhz, 32 MB Ram (64 MB strongly recommended), Svga
monitor, Windows 95/98, Windows NT 4.0 Service Pack 4, or later
Price: End-of-day version, $786; real-time version, $986; US shipping and handling,
$50; overseas shipping and handling, $100. Options: High-probability Fibonacci Zone
Analysis, $240 (real-time only); A W.D. Gann Treasure Discovered book and
videotape, $99 (special price to purchasers of Fibonacci Trader), otherwise $161.80;
30-day trial available, US $25, foreign $35 with refund against purchase.
It's no surprise that Fibonacci Trader continues to appeal to the serious trader, as its creator, Robert Krausz, has more than 20 years of professional trading experience. This software is a direct result of his own trading methods and includes indicators he has developed and uses in his own trading.
The name, I'm sure, will ring a bell with many of our readers. Krausz was featured in Jack Schwager's book, New Market Wizards. He was also interviewed in the September 1995 STOCKS & COMMODITIES, and introduced Fibonacci Trader's core concept of multiple time frame analysis in an article in the November 1996 issue. Recently, Krausz followed up with a discussion in the January 1999 issue, "Multiple Time Frame Trading Using Swing Channels," in which he added channel breakout theory to the mix.
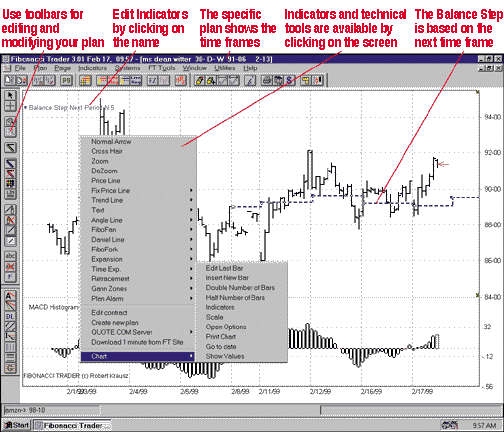
FIGURE 1: FIBONACCI TRADER. Here's Dean Witter using a 30-minute/daily/weekly format. With Fibonacci Trader, you can plot indicators using the base or own time frame -- here, note the MACD in the bottom chart, as well as the next and highest time frame. The Balance Step is plotted based on the daily values, which is the next time frame.
This experience and knowledge has resulted in a powerful trading software program, offering unique indicators and tools. The key feature is the software enables the user to incorporate multiple time frame analysis into one chart. You can see price action and indicators in different time frames without having to switch back and forth between multiple charts, more about this later.
Version 3.01 has a number of new features (Figure 1), including an improved interface
to create, edit, list, and delete contracts and groups, a new interface to modify charts,
an improved import and export data features, and a new systems development module.
SETUP AND DATA
I installed both the end-of-day version and the real-time version, using an HP Vectra VL
Series 3 5/75 and a T1 line. Installation was easy and well-explained in the owner's
handbook included. To use the real-time version, you first must have an account
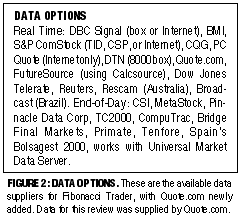
established with the datafeed supplier. The list from which to choose (Figure 2) now
includes Quote.com, used in this review.
Your option for real-time data feeder is entered into the program by selecting Utilities from the menu, and Data Source, then selecting Live Feeder. If you are using the end-of-day version, you can skip this and proceed right to the Contracts section. For real-time users, the program is initially set to Eastern Time, so a correction factor must be entered if you are not in the same time zone as New York.
This correction factor is entered on the exchange screen (Figure 3), and shows an
example what the screen is adjusted to for the West Coast. This procedure will ensure that
the correct time shows up on your charts. The exchange screen can also be further expanded
to enter trading times for the exchanges you follow. For those trading the Asian markets,
gaps in your data can be avoided by entering the time for the lunch break, during which
Asian markets are closed. Delayed data can also be utilized by entering the delay in
minutes on the exchange screen. This whole setup is covered clearly and extensively in the
owner's handbook.
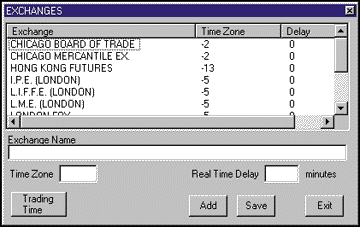
FIGURE 3: EXCHANGE SCREEN. This screen is used to set up exchange information that takes into account which time zone the user is in compared with the exchange time. Here are the settings for someone using Fibonacci Trader on the West Coast. Trading times can be amended, compensation for delayed data can be made, and lunch breaks for Asian markets all can be entered.
Once the various exchanges are set up, contracts for each security to be followed are
customized according to security type (Figure 4). A contract can be thought of as
Fibonacci Trader's database of security data, from which all charts are built. Real-time
contracts store one-minute bars, while end-of-day contracts store daily bars. The contract
dialog is used to specify the exchange on which the security trades, units, and tick size
are also specified, as well as the type of datafeed being used, real time or end of day.
The name and symbol for the security are recorded and organized into divisions. You can
create your own divisions or collections of your favorite markets, all in preparation for
producing a security chart displayed using multiple time frames.
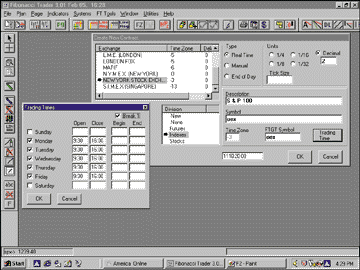
FIGURE 4: CONTRACTS. A contract is established for each security being followed, and it is from this database that the various charts or plans, with different time frames, are built. Each contract is categorized into divisions, and data format and tick size are designated on this screen.
Which brings us to the subject of charts. In Fibonacci Trader, they are referred to as plans because they are not limited to a single time frame; in fact, you can have three time frames simultaneously on each chart. This is the real power of the program. The three different periods have their own terminology as well and are referred to as own, next, and high, in order of increasing time frame.
For example, if you trade the daily bars of Caterpillar, your own period would be daily, your next would be weekly, and your high would be monthly (Figure 5). If you trade the 10-minute bars of the OEX, your own would be the 10-minute bars, the 30-minute bars could be your next period, and daily used for high. For example, in Figure 6 the price bars for the own period are yellow; I have selected encapsulation, which draws price boxes based on the next time frame, along with 13-period moving averages for both own and next periods. This illustrates that both the price bars and the indicators can be displayed in multiple time frames. The encapsulation, for which Krausz has received a patent, gives you an excellent look at how support and resistance levels form based on the next time frame.
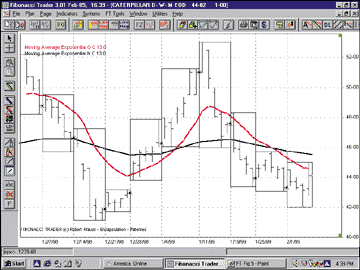
FIGURE 5: CATERPILLAR. The daily bars for Caterpillar are the own period, weekly bars represented by the white boxes are the next period, and monthly is the high period (not shown). Also shown are 13-period moving averages for the own (green) and next (blue) periods, and shows how the same chart can be used to follow multiple time frames.
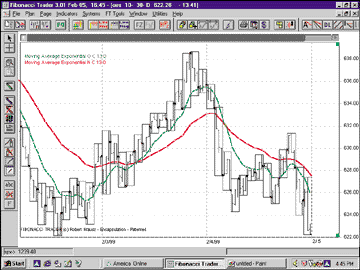
FIGURE 6: S&P 100 (OEX). The same format as Figure 4, except intraday data, is used in this chart. The 10-minute bars are plotted and represent the own period, 60-minute bars were chosen as next, and daily is high. In both Figures 4 and 5, encapsulation is the term given to the containment of the own period bars (yellow) within the next bars, shown in box style (white).
INDICATORS
Indicators, standard and exclusive, are customized using the indicator button or by selecting indicators from the menu. A dialog box pops up (Figure 7) with a menu listing available indicators. There are a number of ways that the indicators can be modified, including color, thickness of line, lookback period, style, draw type, and symbol. These options are provided by clicking the edit button. Most indicators also have the option of occupying their own window below the price bars, unless it would not be meaningful to do so, as in the case of the Gann swing chart indicator. The indicator button or menu is also used to access the dialog to set alarms and trade signals, and displayed on the chart when met.
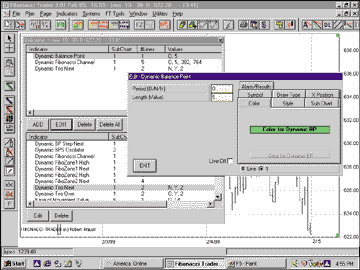
FIGURE 7: CUSTOMIZING INDICATORS. You can edit or customize indicators using the screens shown here. Indicators are selected from the menu and added to the plan after changing the default values, if desired, for color, thickness, lookback period, style, draw type, and so forth. Alarms and trade signals can also be generated by using these screens.
Another function used with the indicator button is the option button. Both the indicator and option buttons belong to the family of plan tools and are found below the main menu. Clicking the option button brings up the dialog shown in Figure 8 and can be used to temporarily hide the indicators on the chart without actually deleting them. This tool also modifies the general plan, including background color (black or white), bar color, bar type (line, OHLC, HLC, candlestick, or volumetric), and display of next period bars (or boxes) with the own bars on the same chart (Figures 5 and 6). The next period bars can be displayed either in encapsulation style, or the same style as the own period bars. Figure 9, in addition to showing the next bars in box style with the own bars in OHLC style, shows two other standard indicators, moving average convergence/divergence (MACD) and stochastics, in their own window below the price bars.
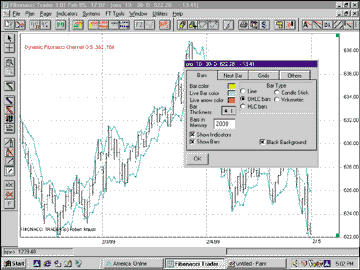
FIGURE 8: CHART OPTIONS BUTTON. This tool is used to customize the general appearance of the plan, such as background chart color, bar color, chart type, and display of next bars as box style, or same style as own bars.
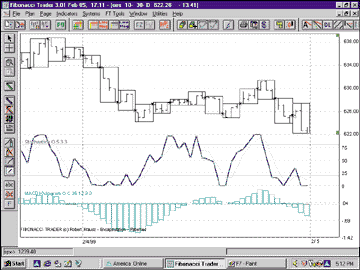
FIGURE 9: S&P 100. The 10-minute OEX bars are shown encapsulated by the 30-minute next bars in box style. Two common technical indicators, stochastic and MACD histogram, are shown below the price bars in their own window.
EXCLUSIVE INDICATORS
All the available indicators can be seen in Figure 10, and the proprietary and nonproprietary indicators available in Fibonacci Trader are listed under the exclusive indicators heading. Many exclusive ones are related to Fibonacci numbers or Gann swing trading, while others were developed by Robert Krausz as a result of his own research.
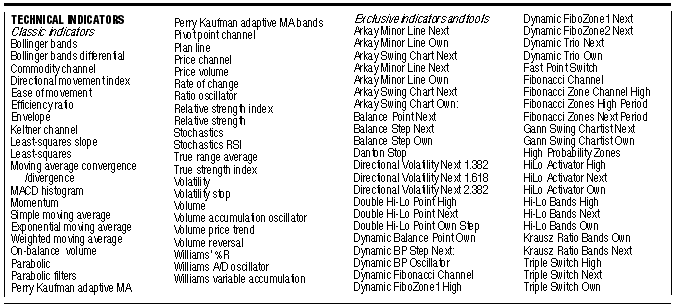
FIGURE 10: Available indicators in Fibonacci Trader, both classic and exclusive, can be seen here.
Gann swing chartist next, shown in Figure 11, is the classic W.D. Gann style swing chart that can be plotted in real time or end of day and can be used in both own and next periods. The direction of the swing shifts from up to down when it is initially up, and two consecutive lower lows occur. Likewise, the swing direction changes from down to up when it is initially down, and two consecutive higher highs occur. This is one of the indicators explained and used extensively in Krausz's book. The trend of each time frame is indicated by a change in the appearance of the line from solid (uptrend) to dashed (downtrend), though this can be customized by the user.
Another of Krausz's exclusive indicators is the hi-lo activator, also shown in Figures 11 and 12, plotted for both the own and next periods. In Figure 11, the hi-lo indicator for the own period are the red and green stairstep lines, and the next hi-lo are blue and purple. The indicator follows the price action either up or down. The hi-lo indicator is used as a trailing stop and an entry action point for Gann swing trading. The indicatorÕs use is detailed in Krausz's book, A W.D. Gann Treasure Discovered.
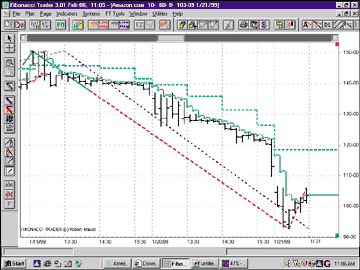
FIGURE 11: AMAZON.COM. Classic WD Gann style swing charting of Amazon.com is combined with one of Fibonacci Trader's exclusive indicators, the hi-lo indicator, as seen here. This chart clearly shows both time frames, own (10-minute) and next (60-minute) in the same trend. The purple dashed swing line is the next period, and the swing line changing from solid green to dashed red is the own period. The dashed swing line indicates that the trend is down. The green and blue step lines is the hi-lo indicator, which can be used as a trailing stop and entry action signal.
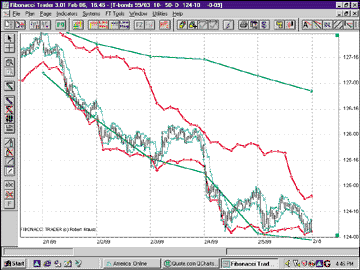
FIGURE 12: MARCH 1999 T-BONDS. Here's an example of applying multiple time frame analysis to the March 1999 T-bond futures contract. This was used in the Fibonacci Trader Journal, and uses the 10-minute/50-minute/daily combination for own/next/high time periods. The indicator used is dynamic Fibonacci channels, using only ratio2 = 0.786 and lines 3 and 4 for each of the three time frames. The blue channel lines are the own, the red lines are next, and the green lines are high.
Not only is the hi-lo indicator described, but its actual use, with extensive backtesting and historical results, are detailed for a number of securities and Treasury bond futures.
Finally, a good way to save time setting up your screen is to utilize the Page feature. This enables you to save a layout of different plans arranged in a particular way, with different appearances and different indicators in each plan. A dialog screen can be produced on selecting page from the main menu, which is used to save the format initially, display the saved formats as pages, and to make changes to existing pages.
MULTIPLE TIME FRAMES
Many professional traders stress the importance of trading with the trend and recommend that if you trade -- for example -- the daily bars, you trade in the direction of the trend as determined from the weekly bars. When both time frames exhibit the same trend, and your trade is in the direction of the trend, probability for profit tends to be greater. If you are a trader using this philosophy, Fibonacci Trader provides you with the ability to monitor both time frames at the same time on the same chart. By comparing the shorter time frame with that of the longer one using various indicators, changes can often be detected first in the shorter period before becoming noticeable in the longer.
As an example of what multiple time frame analysis looks like using intraday data, let's look at a plan of March Treasury bond futures shown in Figure 12. The own/next/high combination for this plan is 10 minutes/50 minutes/daily. We will use dynamic Fibonacci channels as the indicator to illustrate the application of multiple time frames, and three plots of the indicator using different parameters are shown.
Multiple time frames can help identify important areas of support or resistance, and next or high periods commonly define support and resistance areas for the own period. The 10-minute bar is the focus bar, corresponding to the own period, and we look to the higher time frames to indicate possible overbought or oversold conditions. The blue channel lines are the own (10-minute) period, the red lines are the next (50-minute), and the green lines are the high (daily).
Without the ability to plot multiple time frames on one chart, we would have to flip back and forth between three different charts. By examining the behavior of price, relative to the upper and lower channel lines in each of three time frames, trading criteria can be established based on those observations. Fibonacci Trader's system tester can help with that.
SYSTEM TESTER
The system tester can be used as a template for saving combinations of indicators that are used together frequently and to develop basic mechanical trading procedures. Both uses are initiated by selecting systems, and then right-clicking in the window that opens. The indicators saved as a template are saved with the modifications, if any, made as a result of editing the indicator. This can save time in applying frequently used customized indicators.
The second use for the system tester is to develop basic trading procedures, using indicators that only have alarms. All indicators can be displayed, but only the ones with alarms can be used to backtest and provide trading signals. These alarms are used as entry and exit triggers, and the options button on the system dialog screen enables profit protection and stop-loss features. The option to show trades on the chart (Figure13) and to set alarms is also available.
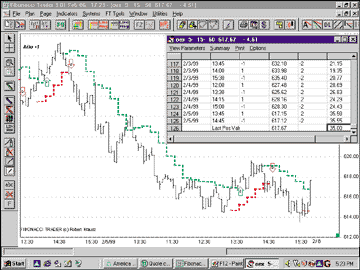
FIGURE 13: S&P 100. Here, we see the system tester applied to the five-minute OEX bars. Any indicator with an alarm function can be used in the system tester to develop mechanical trading procedures. This example shows the name of the system test, hilo-1, in the upper left-hand corner in white lettering. Short positions are indicated by the red arrows, and the number of contracts (options) is shown in the middle of the arrows. The green arrows represent long positions. The results of the backtest for the system is seen in the window in the right-hand corner.
Once your trading rules are established and applied to your charts historically, the results for the backtest are tabulated in three reports. The first report displays trade-by-trade results, including date, time (intraday), quantity, price, stop and reverse quantity, and cumulative tick total produced by the system. The other two reports, the performance report and the risk report, are accessed from the first trade report.
TOOLS
Fibonacci Trader offers a number of drawing tools, which can be accessed either by double-clicking on the chart or by clicking the appropriate drawing or angle tool buttons, located in the toolbars. These tools include cross-hair, zoom, dezoom, price line, fixed Value Line, trendline, text placement, angle line, Fibonacci Trader fan, Daniel lines, Andrews pitchforks, Fibonacci expansions, Fibonacci time expansions, retracement lines, and Gann zones. Many can be edited to user specifications.
Another feature is the FT Tools, accessed from the main menu. These studies pertain to the concept of support and resistance and offer a consistent, methodical method for determining these levels using multiple time frames. Figure 14 shows a plot of stock with Fibonacci zones for the next time frame.
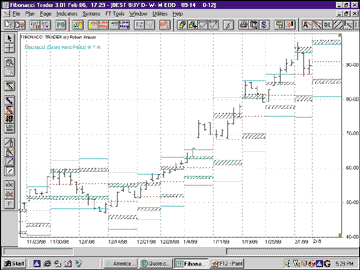
FIGURE 14: BEST BUY. Fibonacci zones can help identify areas of support and resistance and can be seen for the next period of the daily weekly/monthly plan for BBY. This plan combination of time frames is the standard end-of-day version plan combination.
A useful feature of Fibonacci Trader in real-time mode is the ability to update intraday data for missing days. For plans to be updated, the program must be up and running, though it can be in the background. If the program is not running and not connected to Quote.com or another data source, no data will be collected. This is no problem to Fibonacci Trader. Just double-click on the plan you wish to update, click on "Quote.com server," and then click on "Update one-minute bars." PC Quote, S&P ComStock, and Signal Online all provide this ability on their Internet service. A dialog box will pop up, in which you specify the date you want to start updating. This is indispensable for those days for which you are missing data.
The Plan Tools toolbar contains a button for editing bars containing bad ticks or erroneous values, and produces the dialog shown in Figure 15. The particular bar to be edited is selected by clicking the arrows to move to the appropriate bar, which is then highlighted with a contrasting color. This dialog can also be accessed by right-clicking on the bar you wish to edit. This dialog can be further expanded to the one also shown in Figure 15, to ease in the editing of the one-minute bars. This feature provides a fast, easy way to keep your charts correct , either after the session closes or immediately as the error occurs.
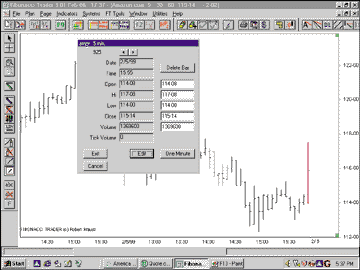
FIGURE 15: BAR EDITING. Selecting the edit-bar button brings up this window, used for correcting erroneous data. This window can be further expanded to display the one-minute bar data, which can also be corrected. The bar to the extreme right of the chart is highlighted red, indicating this is the bar displayed in the edit window.
The Quote Screen, found under the Utilities main menu, allows tracking of securities on a real-time basis (Figure 15) in tabular style. Symbols are entered under the symbol column heading, and the other headings are chosen from the dropdown menu (Figure 16). The data displayed is formatted by right-clicking on the symbol and selecting "properties." Alarms are also set in the same pop-up dialog.
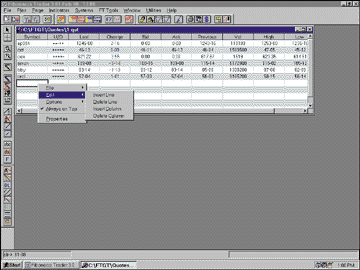
FIGURE 16: QUOTE SCREEN. This feature allows the monitoring of multiple securities in tabular display. There are a number of choices as to the type of information displayed, with some of the more common ones shown here. By right-clicking on the cell containing the security symbol, the window shown here is used to customize the data displayed in the quote screen, as well as setting alarm criteria.
SUMMARY
Fibonacci Trader is a powerful technical analysis charting software program developed by a professional trader, designed for traders, with the ability to formulate and backtest trading procedures. This can be done in either the end-of-day version or the real-time version, and the software is compatible with most of the popular data providers and data formats.
Where this program really excels is in its application of multiple time frame analysis to charting, indicators, and trading procedures. For serious traders looking for a trading program, Fibonacci Trader deserves serious consideration.
Stuart Evens is a Staff Writer for STOCKS & COMMODITIES.
RELATED READING
Hartle, Thom [1995]. "Trading With The Conscious And Subconscious Minds: New Market Wizard Robert Krausz," interview, Technical Analysis of STOCKS & COMMODITIES, Volume 13: September.
Krausz, Robert [1996]. "Dynamic Multiple Time Frames," Technical Analysis
of STOCKS & COMMODITIES, Volume 14:
November.
_____ [1999]. "Multiple Time Frame Trading Using Swing Channels," Technical
Analysis of STOCKS & COMMODITIES,
Volume 17: January.
_____ [1997]. A W.D. Gann Treasure Discovered, Geometric Traders Institute, Inc.
Schwager, Jack D. [1992]. The New Market Wizards: Conversations with America's Top Traders, HarperBusiness.