Bradley Indicator Add-On
This indicator is an add-on for the Fibonacci Trader and the Galactic Trader programs VERSION 4 or later, the price is US169.00 and you need to order it before you can use it. There is no trial for this indicator.
If you already have the Bradley you can also upgrade for $70.00 on the same link below.
The version 4 of the Bradley indicators includes now the
inverted Bradley for all 5 calculations.
Bradley and TechEdge Summation Users Guide Version 4
by Yuri Shramenko
This stock index forecasting tool was designed by astrologer Donald Bradley and published in 1947 in a booklet titled Stock Market Prediction . On the cover this tool is called the Planetary Barometer and inside the booklet it is called a Siderograph. Its simply called the Bradley these days. The Bradley is meant to forecast major and minor turning-points (where a trend will reverse) in either the Dow Jones Industrial Average or SP500 indexes. It does not forecast or anticipate whether that turning-point will be a high or a low, so we say it forecasts non-directional turning-points . In Bradley's own words:
At no time must the reader gain the impression that a siderograph, as such, is a prediction of what the stock market will actually do. Nevertheless, observation proves that basic reversals in collective attitudes, clearly predicted by the line, are inevitably mirrored in stock averages
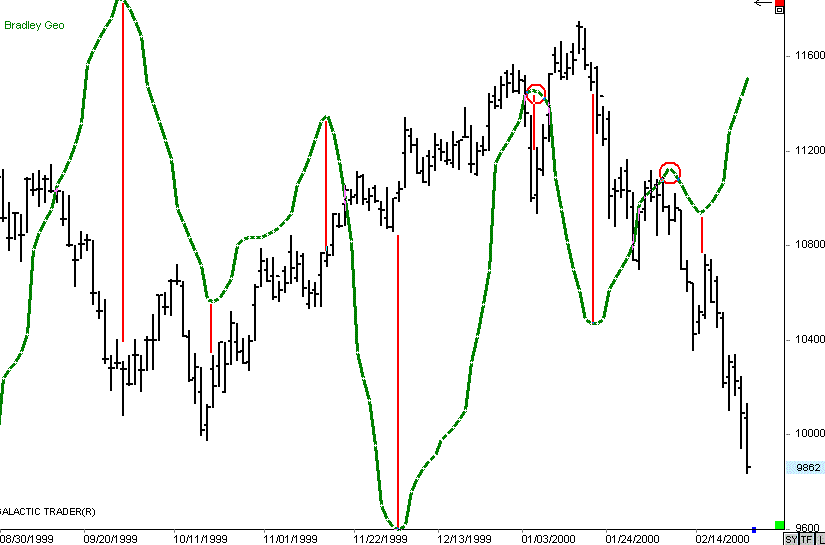
The below example should make this clear. The green line is the Bradley and its easy to see that it did not forecast price direction at all. Yet the Bradley (green line) forecast turning points 100% accurately in the DJ Index for 6 months. Sometimes the Bradley forecast appears to move with the stock-index, but this is not consistently reliable.
To use the Bradley effectively you must remember the following:
-
its only purpose is to forecast trend-changes and it does so accurately
-
it does not tell you if the trend-change will be from a high or low
-
the direction of the Bradley plot inconsistently mimics the direction of the stock-index
-
the amplitude of a Bradley swing (above red lines point to the amplitude of a swing) isn't important; the change of direction of a Bradley swing times a potential trend-change
In trading the Bradley you first should consider which markets to consider. Your choices:
-
DJ or SP or Nasdaq Futures
-
DJ or SP or Nasdaq eMini's
-
Diamonds (DJ) or Spyders (SP) or QQQ's (Nasdaq) (the ETF tracking stocks traded on the AMEX)
-
Single-Stock Future Diamonds and QQQ's
-
Options on futures or mini's
-
Mutual Fund switching
And there are more combinations for traders who combine
stocks, futures, and options in trade setups. Towards the end of this guide I
provide a suggested entry/exit technique for those trading the futures, mini's,
or single-stock futures.
< >Its because of the many trading vehicles available that you may
want to consider Stock Index analysis and trading. While we may often choose a
market to trade and then look for trading techniques, the accuracy of the
Bradley may be reason to first decide to use this tool then find the appropriate
trading vehicle based on your capitalization and risk tolerance.
As the Bradley and its variants forecast turning-points we need to define a turning-point:
-
a rising market changes to a falling market
-
a rising market enters a sideways range
-
a sideways market begins to trend up
-
a sideways market begins to trend down
-
a falling market changes to a rising market
-
a falling market enters a sideways range
Fortunately for traders, most of the time its numbers 1 and 5 in the above list.
The Bradley is a geocentric transit-transit model evaluating planetary aspects. In an effort to gain a trading edge, some have tried the Bradley formula heliocentrically, and other have tried it using natal charts. There are four possibilities:
-
geocentric transit-transit (original Bradley)
-
geocentric transit-natal
-
heliocentric transit-transit
-
heliocentric transit-natal
The natal chart that shows the best results is the New York Stock Exchange founding date, May 15 1792, 8:52 am in New York City. This is sometimes called the NYSE Incorporation chart but factually there was no incorporation at that time (it was an informal agreement among a group of traders to organize trading with specific location and times).
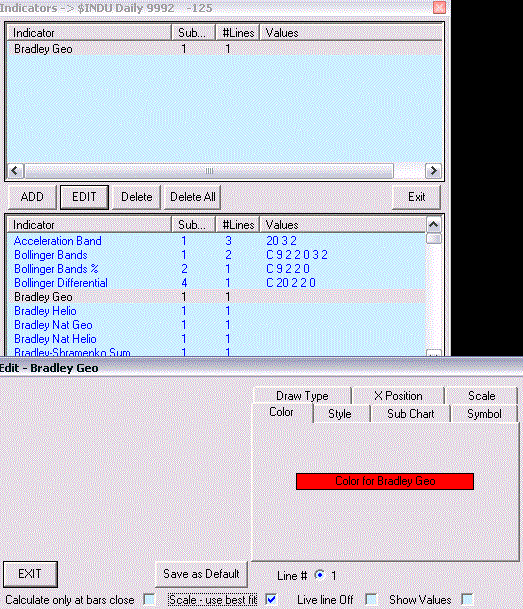
To plot any of these four Bradley's and one Indicator which represents the averaged sum of the four Bradley's, first click the indicator icon. The first time you select one you'll be asked once only to enter your password.
Below are their indicator names. Along the bottom check the box labeled Scale - use best fit as shown below to ensure the plot fits in the price-chart window.
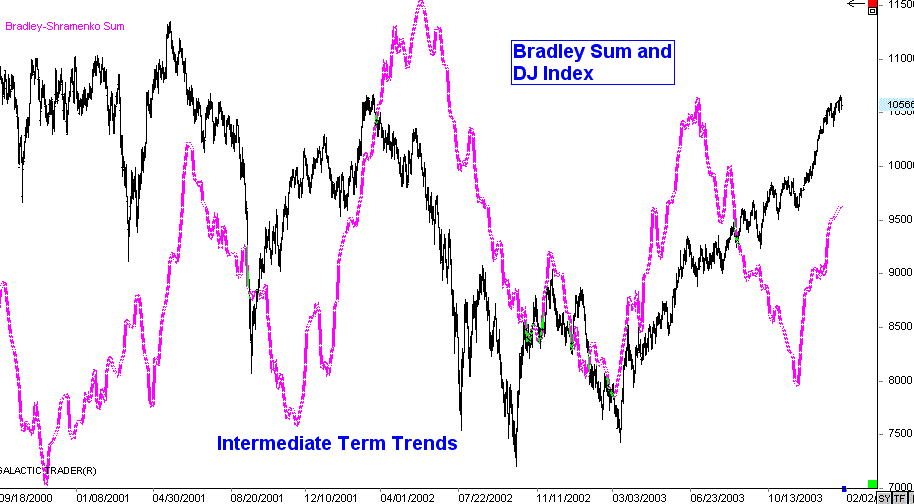
Below is a chart showing a Summation of the original Bradley and the three variations (see above bullets). Here we see over 4 years worth, and the Summation may be useful in this time-frame view to note its major turning points. Using this large timeframe view you have to allow for a week before and week after the Summation turning-point for a move to occur in the stock index.
For swing-trading (short-term trading from pivot to pivot) I'd recommend zooming in on about four months for either the regular Bradley or the Summation. The Summation is more sensitive then the regular Bradley making it more useful for swing trading. While it tends to catch most every short-term turning-point, it also issues a few incorrect turning-points occasionally. The entry/exit technique presented at the end of this guide should keep you out of many these false signals and get you into all the winning turning-point swings.
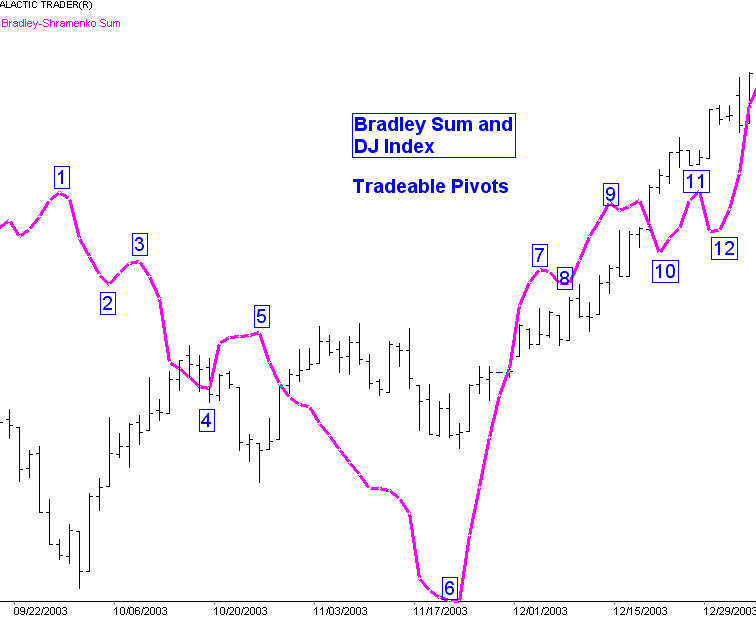
The below chart show 4 months of the DJ Index and the Summation. You see some accurate and inaccurate forecasted turning-points. However, we can use the Summations sensitivity to our advantage. Note that it trends - for example from 1 to 6 we have a downtrend and from 6 to 9 we have an uptrend. Key point : If you ignore the minor turning points that are contrary to the Summations lines trend you increase your accuracy . As these Bradley's forecast years into the future, its easy to note down the date ranges of their trends.
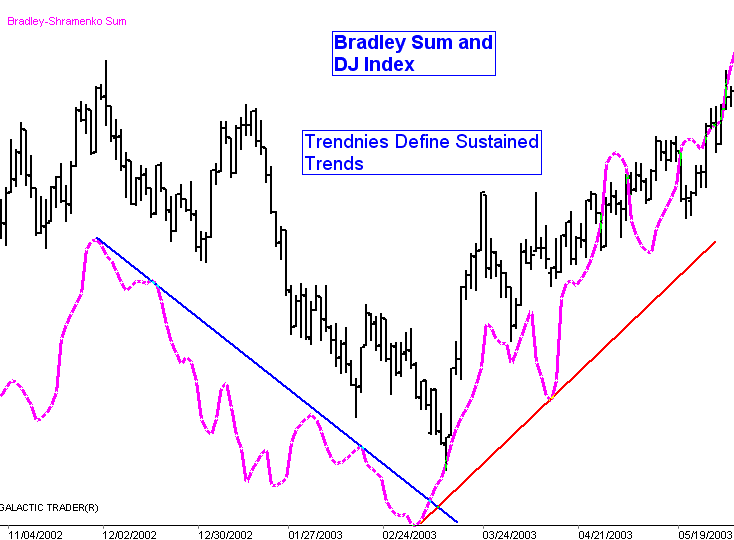
Here is another example for using the trend of the Summation. Often you'll be able to draw trendlines directly on the Summation line. Key point: When those trendlines are broken look for a change in trend
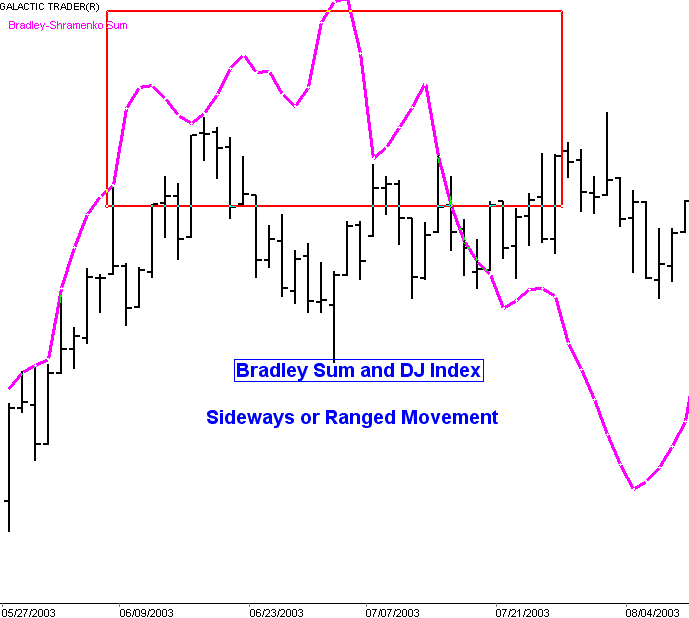
Occasionally you'll notice the Summation forecast entering a sideways range such that you can draw or imagine a rectangle around it, as shown below. Key point : a sideways Summation forecasts the stock-index being choppy . All active traders appreciate knowing when to avoid trend trading.
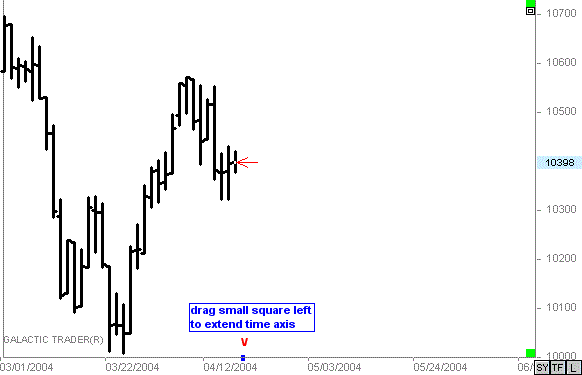
As the Bradley and the Summation can forecast years out, to view the future forecast in Galactic Trader remember that the little square in the lower right of the chart can be dragged to extend the time axis into the future.
Trading a forecast is a little different from trading with any for of technical analysis. Rather then reacting, you are anticipating based on a known time in the future. Using the Summation for Swing-Trading I recommend first creating a time-zone around the forecasted turning-point of 5 trading days. That would be 2 before, the day of , and 2 after. During this time-zone you can apply the following entry/exit technique. If you already are a swing-trader comfortable with a technical system, of course you should continue to use that. Here is a recommendation for those not currently with their own swing-trading technical system.
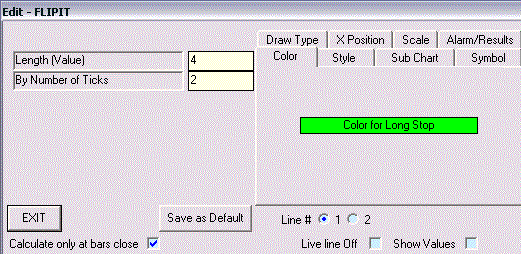
Plot the Indicator labeled Flip It using the below parameters.
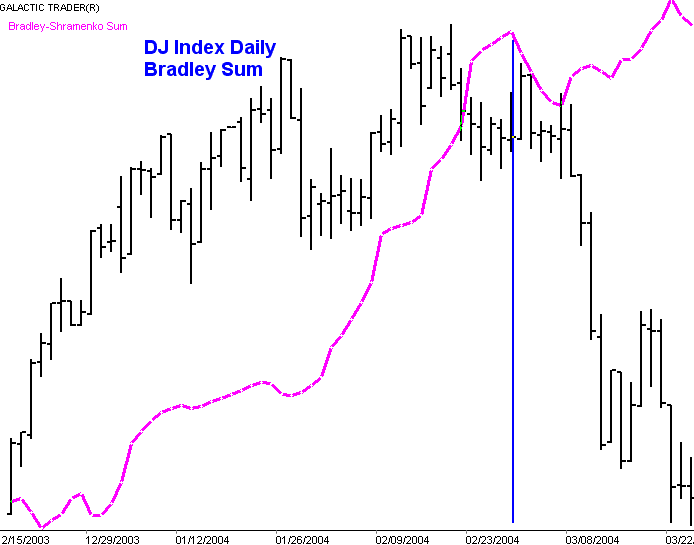
As an example, we have a summation turning point in the last week of February.
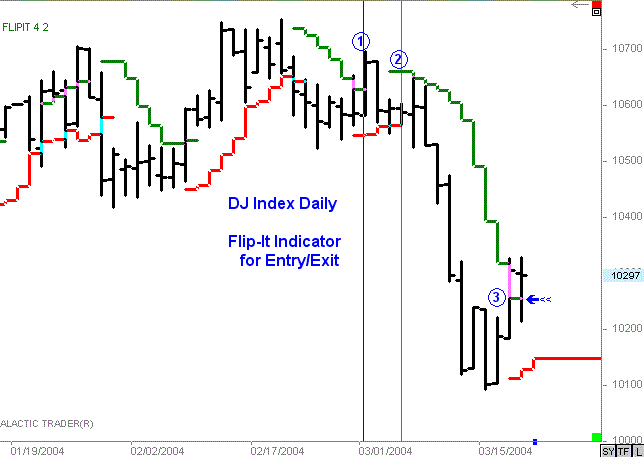
Below you can see the Flip It plotted on the DJ index. Flip It is used as a stop loss in technical systems trading, but in forecast trading its appropriate for both entry and exit. When it plots below price you should be long, and when it plots above price you should be short. Also important is that it plots a value for the next trading day, allowing you to place a stop or stop-limit order for the upcoming trading day. The blue vertical line below (1) is the day of the forecasted Summation turn. Using Flip It you would have entered the market at the (2). Flip-It would have you out of the market at (3), see the blue arrow.
For those trading the intermediate trend instead of the illustrated short-term swing timeframe, I recommend the Chandelier indicator, which would be used the same as Flip It.
Yuri Shramenko
Technical Edge Ent.
