GETTING STARTED
(for Fibonacci Trader SRV 4.1)
The following is a step by step process to get started using the Fibonacci Trader Program (FT SRV version)
You can watch most of the Fibonacci Trader functions at the videos page.
CLICK HERE FOR THE VIDEOS PAGE
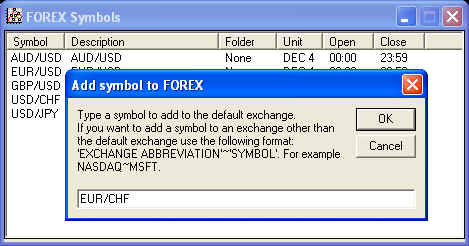
Creating a symbol is easy.
Just press the F5 key, the box asking for a symbol will open. Type the symbol you want, in this case EUR/CHF.
Note all trades on our feed and database are time stamped in GMT, then all symbols you create using our feed should use the FOREX exchange. On the SRV version the FOREX exchange is set as the default exchange, you do not need to change anything.
Click Ok and a daily/weekly/monthly chart of the symbol will open, wait a while, FT will download the data.
For a list of our symbols click HERE.
Creating a chart
There are many ways to create charts.
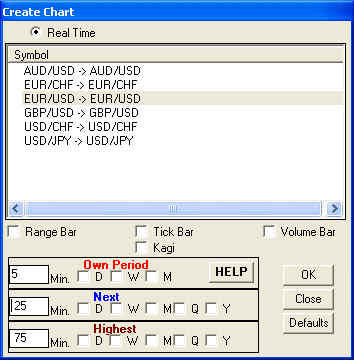
Right-click an open chart, click Create New Chart, select 3 new time frames.
The next picture shows the parameters to create 5/25/75 chart of EUR/USD.
Also you can click the
 button to open the same previous window, or on the main menu click on File, New Chart (Control-W).
Charts control window
On the menu click on Chart. The Chart control window will open.
Right click on any symbol and select the option you want on the menu..
Finally, lets add an indicator a chart.
For our example we are going to add the Dynamic Trio Next to our 5/25/75 EUR/USD chart we just created. Since we are selecting a next time period indicator on a 5/25/75 chart, the indicator will use 25 minutes prices to calculate itself but will be drawn on the 5 minute bar chart. This is the Multiple Time Frame concept in action and the real strength of the Fibonacci Trader Program.
If you have more than one chart open, click on the chart that you want to add an indicator to in order to make it the active window.
Click Indicators. A window appears showing a list of the indicators that come with the program Using the vertical scroll bar in the indicators window press the down arrow until you can see the Dynamic Trio.
Click on it to highlight it.
Press add. You will then see the Dynamic Trio Next in the indicator window above. Click exit to see the indicator on your chart.
You will also see the name of the indicator and its given parameters printed in the upper left hand corner of your chart. Right clicking on the name of the indicator will bring up a menu that allows you to choose to edit or delete the indicator.
Since 1992